We’ve been working with Sadiq Khan’s team at the Greater London Authority to raise awareness of their ‘Smart London’ consultation — which looks at how the city uses data to improve public services.
To do this, we built a website which tells people how many Londoners do their Tube journey every day, based on survey and Oyster card data from TFL.
So far, the site has been successful in reaching new audiences: 91% of visitors in Google Analytics are new to London.gov.uk. It’s also been great at engaging them, with 84% of people taking the first step of the journey.
But beyond this, the site has taught us a few things too. As part of setting up the journey, we ran a couple of tests that produced interesting, counter-intuitive results, so we wanted to share them.
Telling people how many others are on the site
What we tested
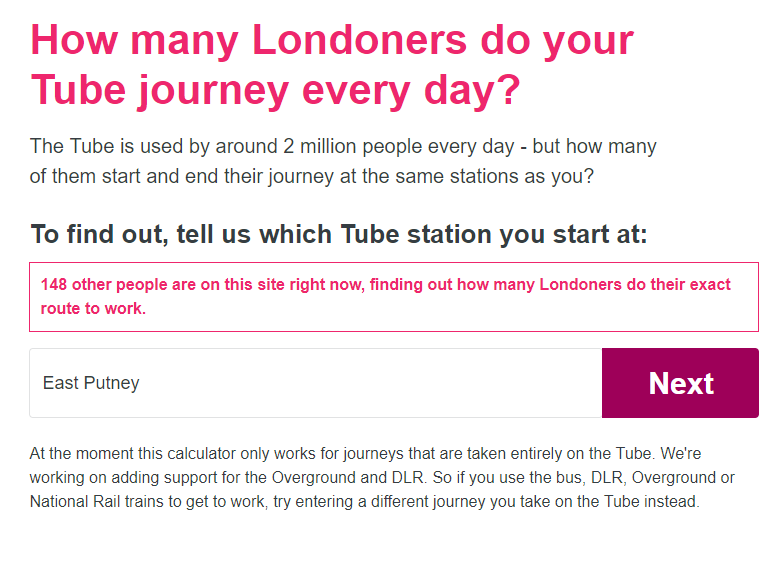
We tested adding a counter to the first page of the journey, which showed people how many other users were on the page at the same time as them.
This is a mechanism we’ve seen on other sites (such as booking.com) and our hypothesis was that it would give the user an immediate and tangible sense of social proof. Our goal was to increase the proportion of visitors who landed on the page and then engaged with it, making their way past the first step.
What we found
Adding the counter decreased the number of people completing the front slide by 2.8% (statistically significantly).
Analysis
We think that this might have been because the number changed every time a new user landed on the page, so it could have distracted people from the main ask of the site. It could have also been because the number made users uneasy: on hotel booking sites this tactic is used to make you feel anxious that rooms will go.
What we’d like to test next
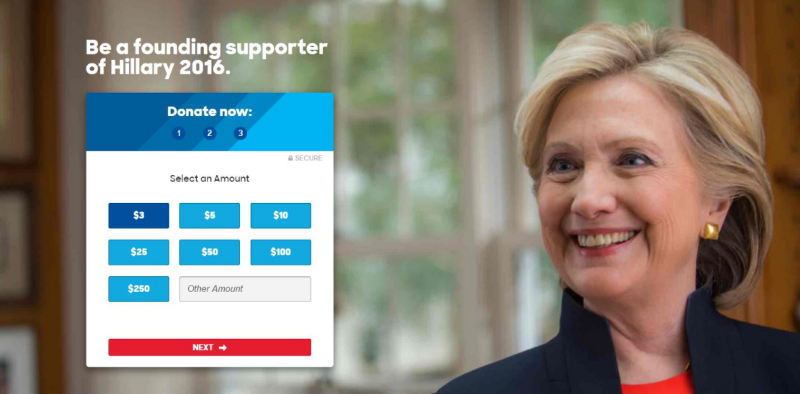
We’d like to retest this with a variety of designs and page types (testing it on a petition or a donation page, for example).
What do you think about this test? Have you tested anything similar? Do you have any ideas for other tests like this that we could run? Let us know in the comments.
Personalising the Facebook share image
What we tested
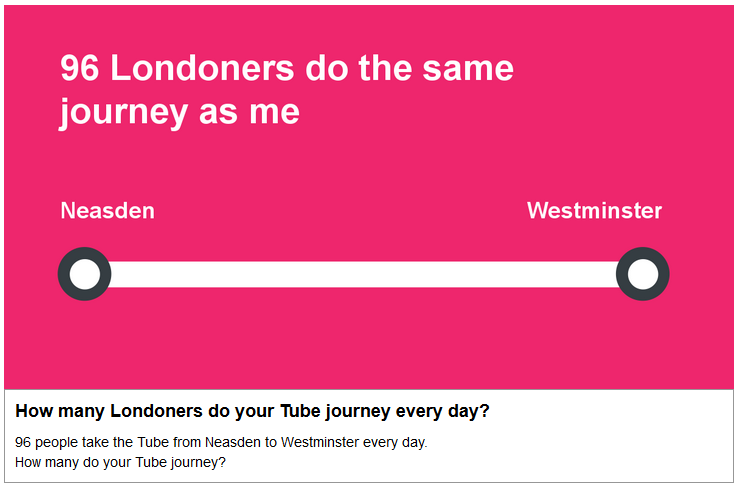
We also tested two different versions of the image and text that people were invited to share on Facebook after using the site — one that showed their start and end station, and one that didn’t.
Control: more personalised version
Variant: less personalised, more private version

We’ve seen personalised results work well on other projects we’ve worked on (for example here, here and here). However, a number of people in the teams at both the GLA and Forward Action raised privacy as a concern: would people want to advertise where they travel every day?
Which is why we decided to test a version that only shared the user’s result (the number of people who share their journey), but not the names of the stations on their commute.
To test the relative success of each version we measured two different metrics:
- the number of people clicking on the share button
- the number of people who came to the page after seeing the posts in their Facebook timeline.
The most important metric here is the second one: number of people coming to the page, as that’s the best metric we have for growth.
What we found
The variant increased the number of people clicking on the share button by 28% and the number of people landing on the page by 37%. Both results were statistically significant.
Analysis
The first thing to note on this result is that it looks to us like there are a lot of people sharing this journey by either copying and pasting the link, or using their mobile browser’s sharing functionality.
We’ve not seen such a high number of people coming to a page relative to the number of people clicking on the share buttons before. In this journey our analytics were telling us that 10 people were visiting the page from every share button click; normally it is less than one.
This contradicts with other tests we’ve run where personalised results greatly increase performance. Our instinct is this result was driven by one, or a combination of two, things:
- The personalised travel information in the share image was putting people off sharing, reducing the clicks on the share button in the first place.
- The less personalised version had the question headline actually in the graphic, which increased the number of people clicking on the link in Facebook.
What we’d like to test next
It may be this isn’t a generalisable finding, so we’ll need to run tests to explore both these explanations on future projects.
What do you think about this test? Have you tested anything similar? Do you have any ideas for other tests like this that we could run? Let us know in the comments.